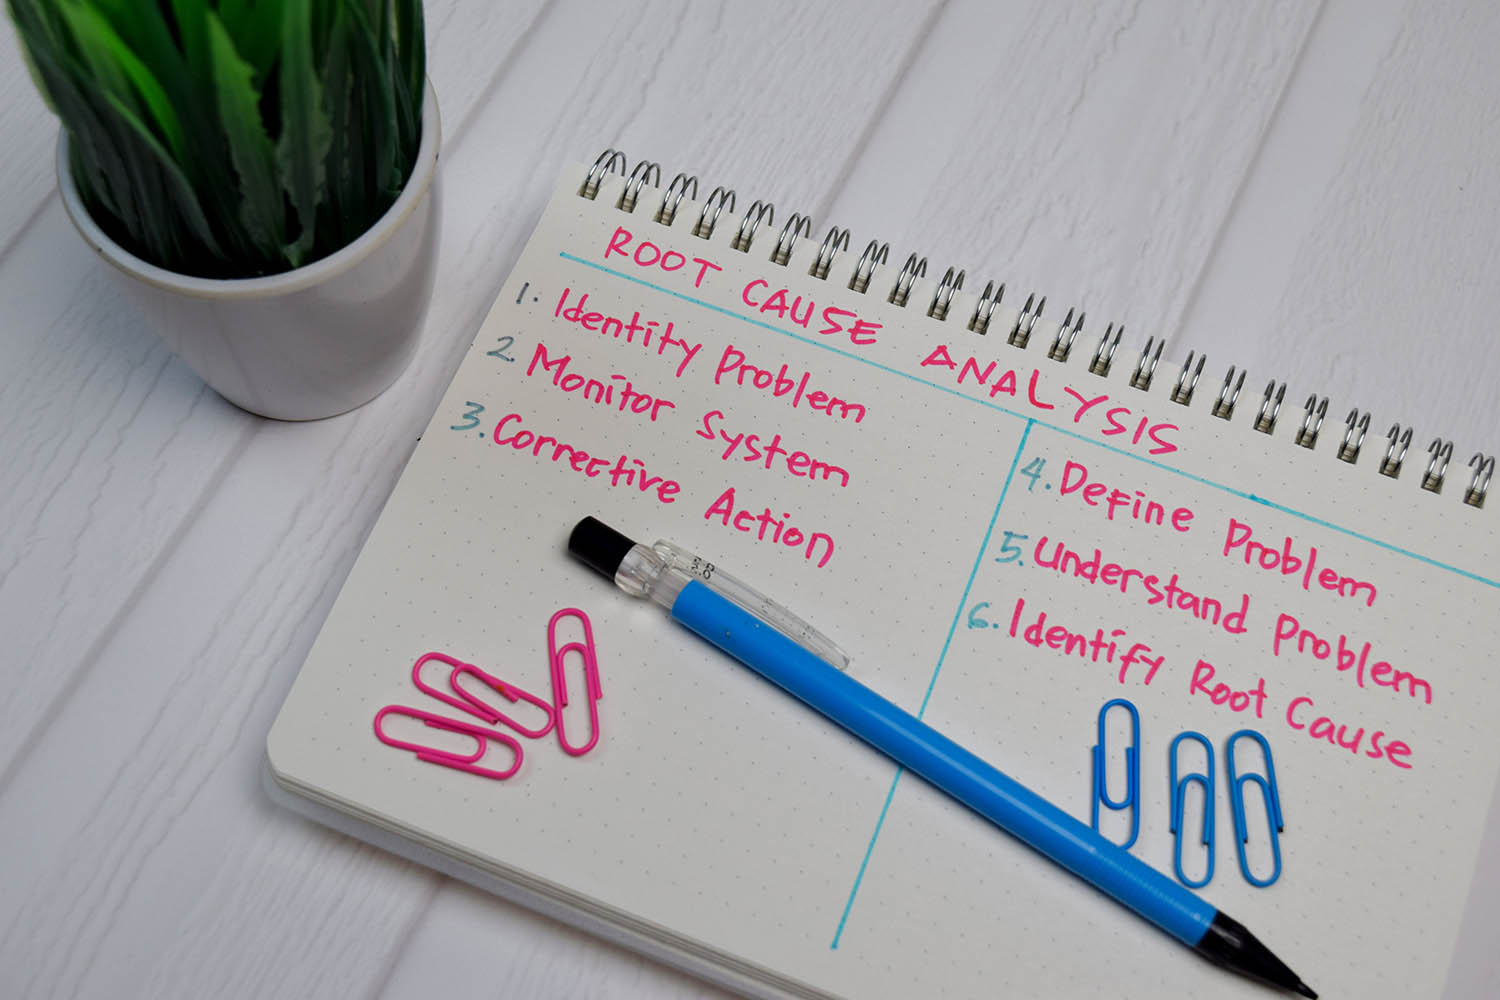
Start at the beginning. Root Cause Analysis can be applied in different ways. Root cause analysis is problem solving. Its taking the hit now over short term Band-Aids that got you to where you are today. It’s also important to understand there could be more than one issue.
Roll out RCA with key participants, this way it does not default to pointing fingers. The process owners are essential to the team, but do not have them bring the ‘solution’ they think is obvious… most often its not.
The next step is to briefly show them different models and “see which best fits the situation” once agreed upon, let them apply their ideas to match the model. Now they have seen the relationships, take suggestions, but take nothing you cannot implement.
RCA can vary in difficulty, you may have heard of them. Failure Mode & Effects Analysis (FMEA) used for failure within a closed system. Fishbone Diagram offers a diagram to group causes into different sub categories for easier determination of the cause. Another is Pareto Charts this uses a diagram like a bar chart that ranks measures in decreasing order of occurrence. The Pareto model segregates the trivial from the significant problems. This is highly effective for Demand Planning success. Using a bar chart allows the team to see the changes that need to be made. Also think of the 80/20 rule. Fault Tree Analysis is a method that uses Boolean logic. You move through the “tree” branches writing down all of the potential causes of the issue at hand. Lastly we have the Scatter Plot Diagram. This method observes the relationships between variables. Dot positions are represented on a horizontal and vertical axis indicating values of individual data points.

